
Author Archives: Michael Froomkin

Florida’s Evil Policies Become More Visible

I hate to quote Politico, which I tend to think is both biased and given to the worst horse-race journalism, but when they’re right they’re right: ‘It’s a sh– sandwich’: Republicans rage as Florida becomes a nightmare for Trump:
Already anxious about Trump’s chances in the nation’s biggest swing state, Republicans now are dealing with thousands of unemployed workers unable to navigate the Florida system to apply for help. And the blowback is directed straight at Trump’s top allies in the state, Gov. Ron DeSantis and Sen. Rick Scott.

Privately, Republicans admit that the $77.9 million system that is now failing Florida workers is doing exactly what Scott designed it to do — lower the state’s reported number of jobless claims after the great recession.

“It’s a sh– sandwich, and it was designed that way by Scott,” said one DeSantis advisor. “It wasn’t about saving money. It was about making it harder for people to get benefits or keep benefits so that the unemployment numbers were low to give the governor something to brag about.”

Republican Party of Florida chairman Joe Gruters was more succinct: “$77 million? Someone should go to jail over that.”

With hundreds of thousands of Floridians out of work, the state’s overwhelmed system is making it nearly impossible for many people to even get in line for benefits.

The new online system was part of a series of changes designed to limit benefits. The ultimate goal — which it delivered on — was to lower unemployment taxes paid by Florida businesses. A 2011 analysis done by the Florida Legislature estimated that the changes pushed by Scott would save businesses more than $2.3 billion between 2011 and 2020.

Now, as thousands of people try to get help, the system crashes or denies them access. Nearly 400,000 people have managed to file claims in the last two and half weeks. It’s not known how many have tried and failed.

Most of those who do submit applications won’t qualify for aid, and the benefits that are paid out are among the most meager in the country — a maximum of $275 a week.

Posted in Econ & Money, Florida | 2 Comments

When an “Emergency” is Not an Emergency

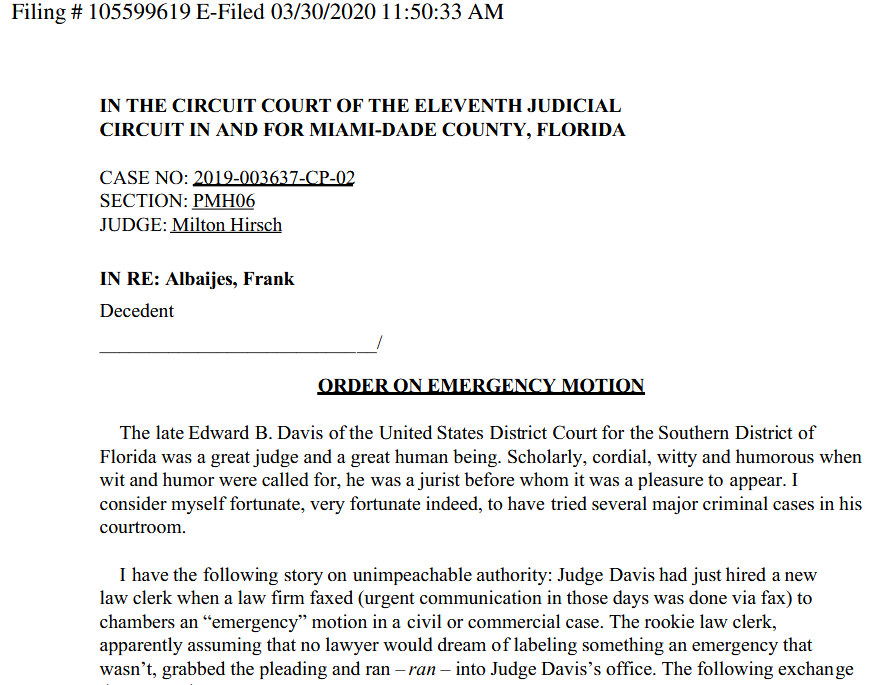
David Oscar Marcus, local federal courts blogger extraordinaire, brings us this self-explanatory tale of Judge Milton Hirsch 1 denying a self-styled “Emergency Motion”. Along the way, the eloquent jurist manages to invoke the ghosts of the late Judge Edward Davis and of Shakespeare. Not bad for a three-page order!

View full document in Scribd.

Law students take note. Don’t let this happen to you.

  1. When local lawyers see this name they know it’s going to be good.[]
Posted in Law: Ethics | 1 Comment

MiamiLaw COVID-19 Webinar Now Available Online

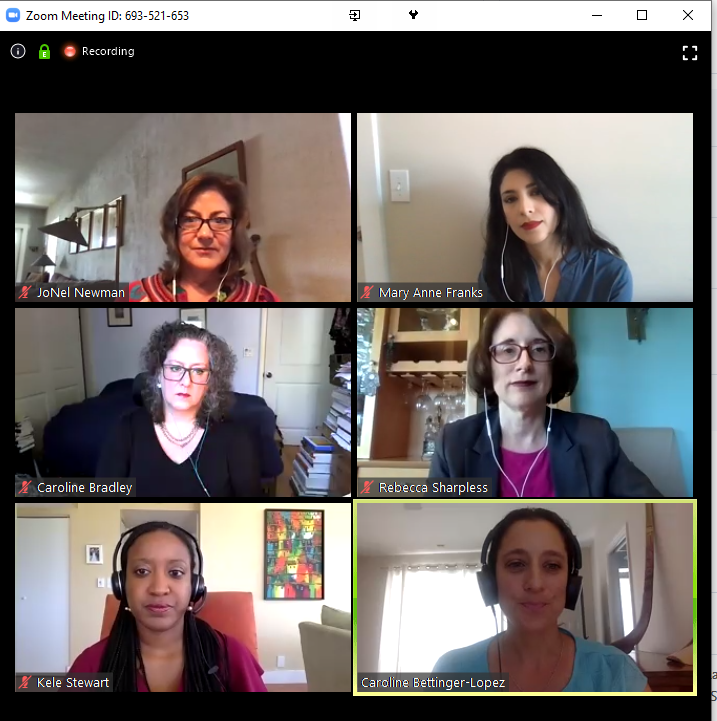
You can now get the whole COVID-19 and the law webinar, and it’s free as in beer.

They did have a couple minor technical glitches in the original, but I gather they edited them out to make this a seamless production.

Posted in Law: Everything Else | Comments Off on MiamiLaw COVID-19 Webinar Now Available Online

Our New Normal

Webinars!

UM Law put on a good one today about Law and Cornavirus.  Announced only a few days ago, it drew over 500 viewers. They’re likely to do a sequel. Meanwhile, I gather a recorded version should be online Real Soon Now.™

Posted in COVID-19, Law: Everything Else, Talks & Conferences | Comments Off on Our New Normal

When Not to Get COVID-19 in Florida

No time is a good time to get COVID-19. But if I understood it, the healthdata.org site predicts that in Florida the worst time to get COVID-19 will be about April 15-May 15, in that the demand for ICU beds will outstrip supply in that period. Interestingly, the healthdata.org site doesn’t predict that there will be no hospital beds at all at any point. Of course it’s a big state, so a bed in the Panhandle is of limited use in Miami, or vice versa.

There might, I fear, be another problem with this projection that causes it to understate the problem: a bed is not much use without healthcare workers. I don’t see any sign that these projections take account of the possible toll on doctors, nurses, technicians, and other support personnel in hospitals, although again it’s entirely possible I’m missing something. In some scenarios, the absence of medical professionals due to illness, ill family, childcare needs, or other factors might be a bigger constraint than beds at some critical times.

I’m also not real clear on why this and other estimates put the Florida peak so much later than most other states given that we seem to be ramping up quite quickly. Can anyone explain please?

Posted in COVID-19 | 2 Comments

What if the Virus Has Spread Much More than We Think?

COVID-19 map

COVID-19 spread as of 3/30/20 10:04 AM per Johns Hopkins

Christopher Balding, a professor at the HSBC School of Business, Peking University, has a very interesting short paper on “How Fast is Corona Spreading and How Many Undetected Cases Are There?” (alt version: pdf with hyperlinks to references).

It paints a very different picture of the epidemiological numbers than the most widely discussed models do; on the whole, but not in certain parts, this is a more cheerful less dire picture as well.

Prof. Balding slices and dices exposure numbers to conclude that:

  • Given conservative estimates of the speed at which COVID-19 spreads, current national statistics must very substantially undercount the number of people exposed as there are more cases than can be explained given the timeline.
  • Because a lot of the tests are faulty, national statistics probably also undercount the number of people with negative tests (this makes the first point even worse).
  • Iceland’s population sample found a lot of people with positive test results who had no or only very mild symptoms, i.e. people who would never even be tested under current criteria for rationed test supplies.  The Netherlands reports a similar result.

From this, he concludes that:

  • “[T]rack and trace is a pointless.” The genie is out of the bottle.
  • “[C]ase severity out of the infected population is actually much much lower and by one account on par with flu outcomes. Current numbers widely used in the press grossly distort the reality by measuring data at known severe outcome locations. This is like measuring driving safety at a hospital.”
  • “[G]overnments would be well advised to focus mitigation efforts on less intrusive and disruptive behavior rather than near total economic shut downs.”
  •  A “key factor in outbreaks has been super spreader nodes. From South Korea to Italy, there are clear examples of super spreader nodes. In many cases those nodes can be responsible for the overwhelming number of cases. Rather than disrupting an entire country, it is important to focus efforts on mitigating and detecting those nodes.”
  • “[T]here are clear examples of medical resources being taxed at super spreader locations. Public policy interventions would best be focused on helping allocate medical resources to specific locations rather than using broader blunter instruments.”

Lastly, he notes “a meta study of corona R0 found a pooled R0 number of 3.32 with a mean of 3.38; probability of being diagnosed correctly with severe symptoms at 0.6, diagnosis probability with mild or asymptomatic at 0.001, and the probability of developing severe symptoms at 0.01; higher transmission from interval between incubation and symptom onset allowing carriers to infect larger number of people.” [R0 is the critical rate of infection number, and is defined as the average number of infections each infected person will cause.]

I have no independent idea if any of Prof. Balding’s numbers are right; I’m not endorsing it, but I found it interesting.  An R0 of 3.32 is high, but R0 estimates have been all over the place. And it’s quite a bit higher than WHO’s current estimate!  Note that for the 3.32 number to be in the right neighborhood, the lethality also has to be down, otherwise we would have seen a lot more deaths sooner given current estimates of when the infection began.

None of which means, by the way, that the real dangers to sub-populations at risk (e.g. older people), and people in hot spots like New York are any less real.  If anything it suggests places can become hotspots pretty quickly.

For those who wish to play with numbers, more data than I can parse can be found at the Worldometer.

Posted in COVID-19 | 1 Comment