
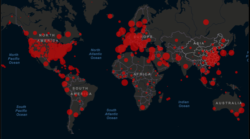
COVID-19 spread as of 3/30/20 10:04 AM per Johns Hopkins
Christopher Balding, a professor at the HSBC School of Business, Peking University, has a very interesting short paper on “How Fast is Corona Spreading and How Many Undetected Cases Are There?” (alt version: pdf with hyperlinks to references).
It paints a very different picture of the epidemiological numbers than the most widely discussed models do; on the whole, but not in certain parts, this is a more cheerful less dire picture as well.
Prof. Balding slices and dices exposure numbers to conclude that:
- Given conservative estimates of the speed at which COVID-19 spreads, current national statistics must very substantially undercount the number of people exposed as there are more cases than can be explained given the timeline.
- Because a lot of the tests are faulty, national statistics probably also undercount the number of people with negative tests (this makes the first point even worse).
- Iceland’s population sample found a lot of people with positive test results who had no or only very mild symptoms, i.e. people who would never even be tested under current criteria for rationed test supplies. The Netherlands reports a similar result.
From this, he concludes that:
- “[T]rack and trace is a pointless.” The genie is out of the bottle.
- “[C]ase severity out of the infected population is actually much much lower and by one account on par with flu outcomes. Current numbers widely used in the press grossly distort the reality by measuring data at known severe outcome locations. This is like measuring driving safety at a hospital.”
- “[G]overnments would be well advised to focus mitigation efforts on less intrusive and disruptive behavior rather than near total economic shut downs.”
- A “key factor in outbreaks has been super spreader nodes. From South Korea to Italy, there are clear examples of super spreader nodes. In many cases those nodes can be responsible for the overwhelming number of cases. Rather than disrupting an entire country, it is important to focus efforts on mitigating and detecting those nodes.”
- “[T]here are clear examples of medical resources being taxed at super spreader locations. Public policy interventions would best be focused on helping allocate medical resources to specific locations rather than using broader blunter instruments.”
Lastly, he notes “a meta study of corona R0 found a pooled R0 number of 3.32 with a mean of 3.38; probability of being diagnosed correctly with severe symptoms at 0.6, diagnosis probability with mild or asymptomatic at 0.001, and the probability of developing severe symptoms at 0.01; higher transmission from interval between incubation and symptom onset allowing carriers to infect larger number of people.” [R0 is the critical rate of infection number, and is defined as the average number of infections each infected person will cause.]
I have no independent idea if any of Prof. Balding’s numbers are right; I’m not endorsing it, but I found it interesting. An R0 of 3.32 is high, but R0 estimates have been all over the place. And it’s quite a bit higher than WHO’s current estimate! Note that for the 3.32 number to be in the right neighborhood, the lethality also has to be down, otherwise we would have seen a lot more deaths sooner given current estimates of when the infection began.
None of which means, by the way, that the real dangers to sub-populations at risk (e.g. older people), and people in hot spots like New York are any less real. If anything it suggests places can become hotspots pretty quickly.
For those who wish to play with numbers, more data than I can parse can be found at the Worldometer.
One way to sanity check the case count to see if there is gross undercounting is to divide the deaths by the Infection Fatality Rate (IFR), which is estimated at 0.6% (albeit with a large 95% CI). That should give the approximate infection count about two weeks earlier. As I write this, worldometer gives worldwide deaths as 47,245, so about two weeks infections were probably about 8 million. Since the case count two weeks ago was 182,414, this suggests the case count is low by about a factor of 40. Even if the IFR were as high as 1.7%, it still suggests cases are a factor of 15 off from infections.