
Interesting Twitter thread about the following question: If you plot the US state-by-state COVID infection rates since Sept 1, 2020–i.e. the recent and now receding surge–which is a better predictor:
- The percent of the population infected before Sept 1, or
- The margin of Biden’s victory in the state?
You might expect that states which had lots of COVID before Sept. 1 would have more of it after Sept. 1 for the same reasons they were getting it earlier. Or, I suppose, you might expect the reverse: states learn from their mistakes, and if infection rates were higher earlier then more people have immunity, so there’s a negative relationship between earlier infection rates and later infection rates.
According to Youyang Gu, both of those expectations are broadly wrong: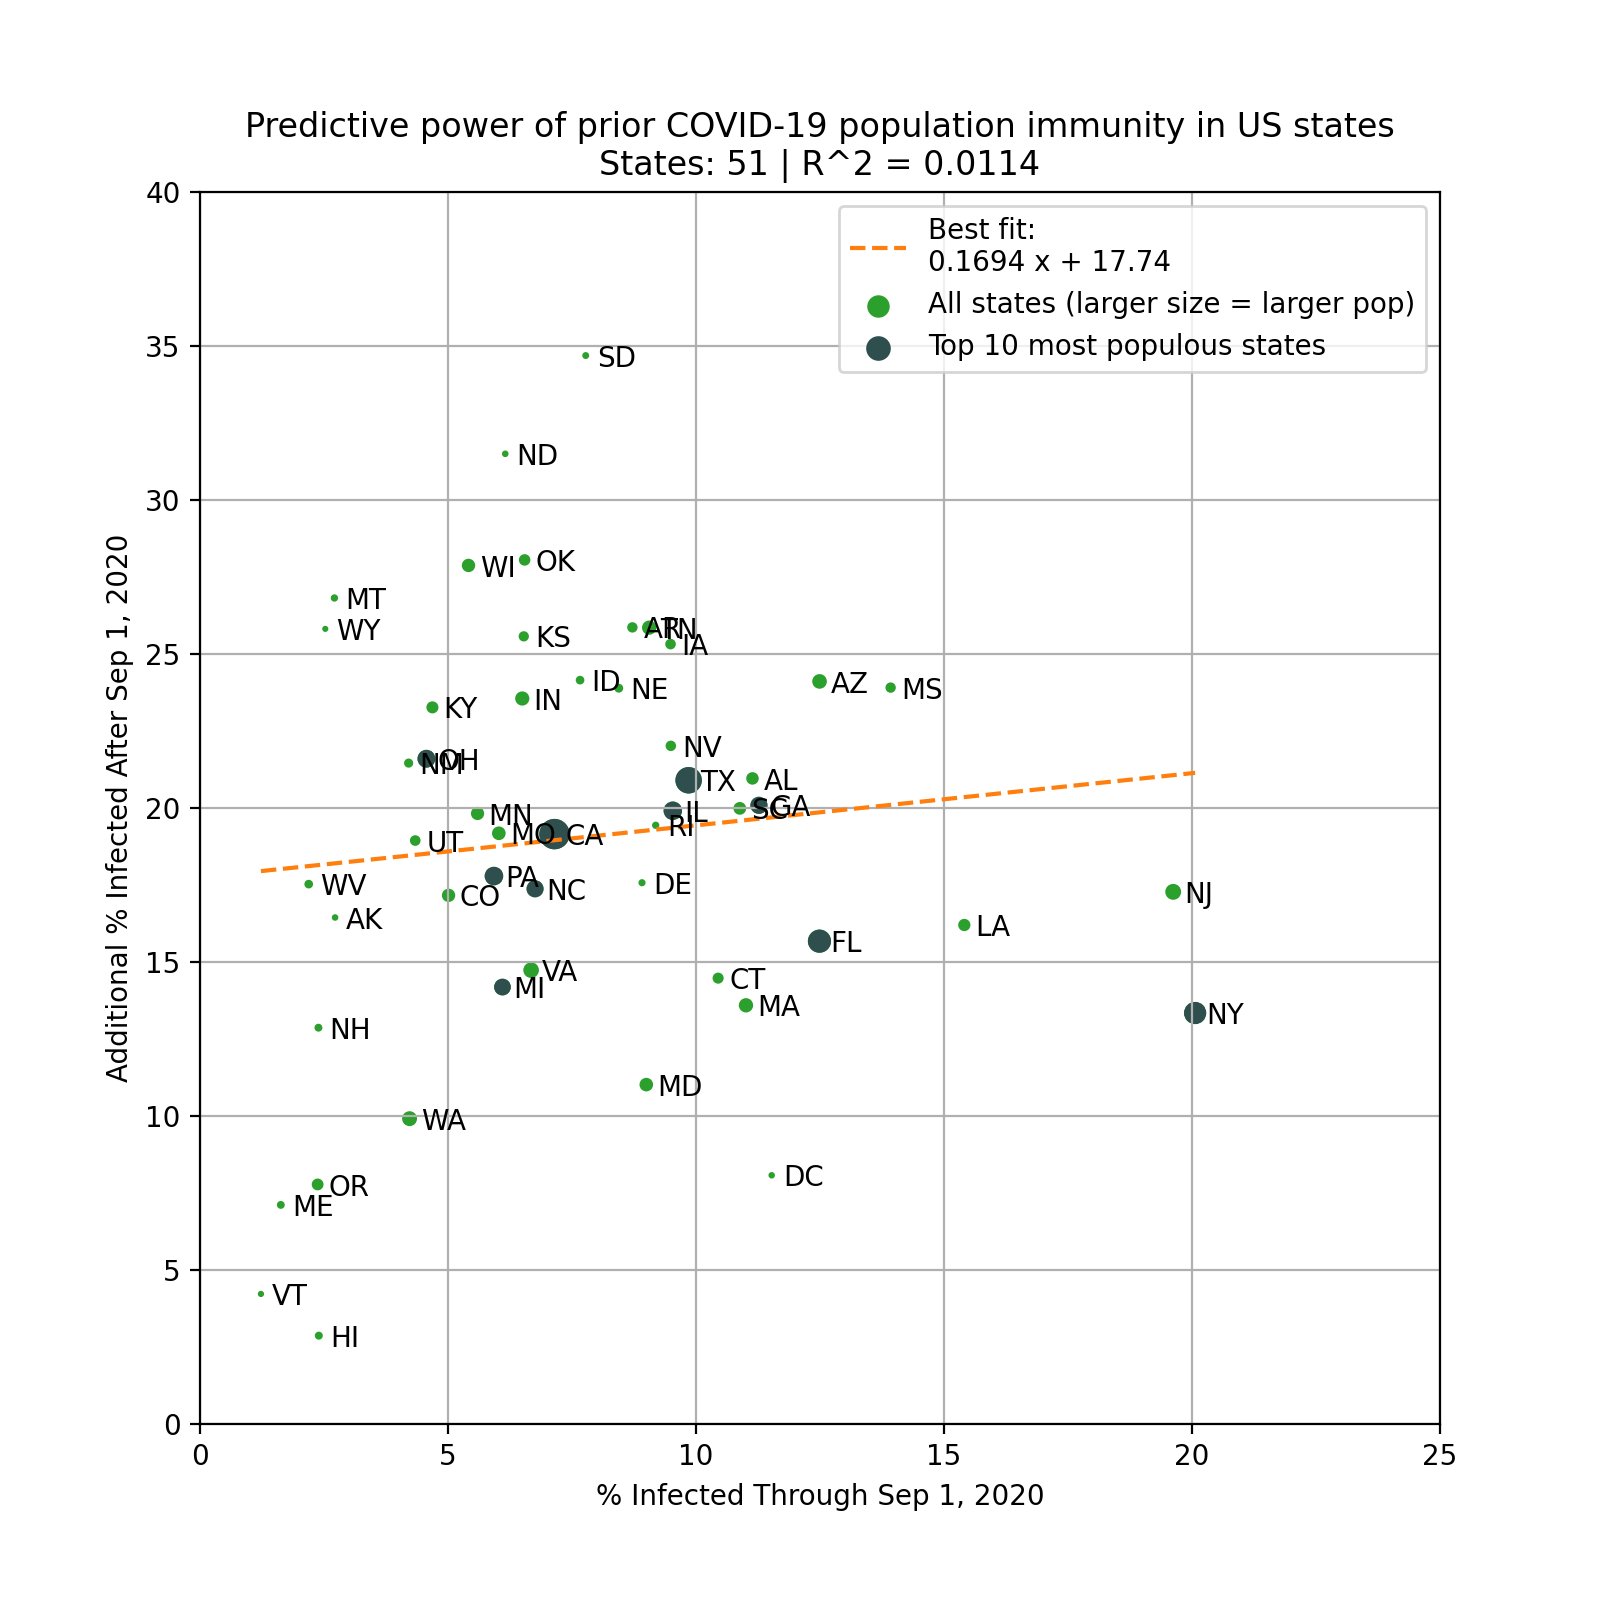
Instead, the single variable with the most predictive power is how strongly states voted for Biden.
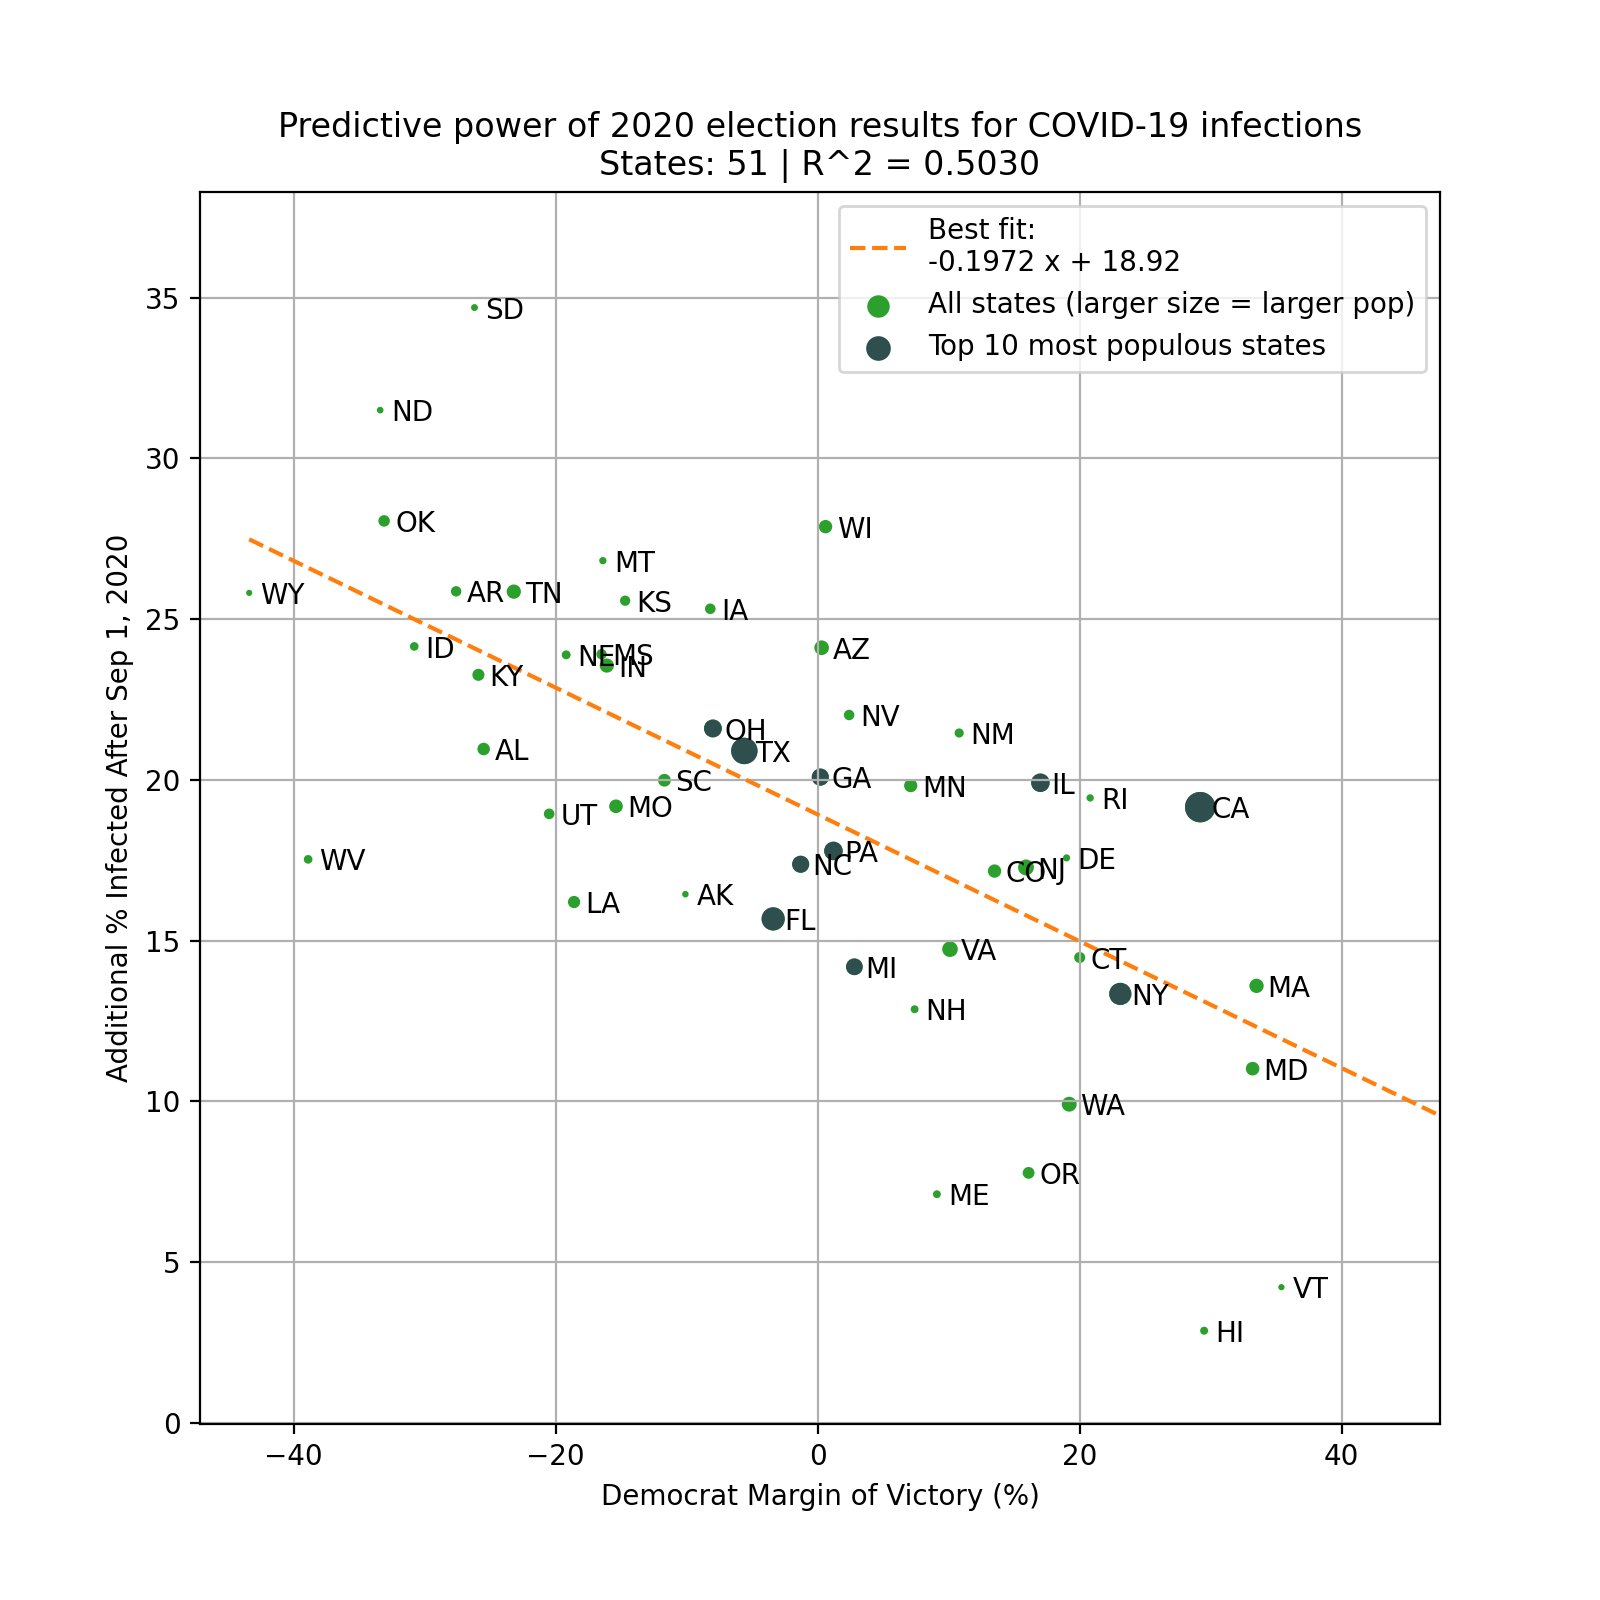
As commenters in the thread note, at an R-squared of about 0.5, this is not a fully explanatory variable–there’s a lot going on, no doubt. Youyang Gu’s suggestive claim is only that as single-variable explanations go, this is the most powerful.